POL 478H1 F
Intro to Graphics
Olga Chyzh [www.olgachyzh.com]
Visualizing Large Datasets
The challenge---aggregate to a suitable level
Useful commands: summarise, filter, mutate
Example 1
Question: Are democracies more vulnerable to terrorist attacks?
Motivation:
Civil liberties (privacy, freedom of movement) facilitate communication and planning;
Freedom of the press amplifies the audience effect of attacks.
Load the Data
library(classdata)data("terr_attacks")str(terr_attacks)## 'data.frame': 16120 obs. of 10 variables:## $ country : chr "Afghanistan" "Albania" "Algeria" "Angola" ...## $ ccode : num 700 339 615 540 160 371 900 305 373 692 ...## $ cabb : chr "AFG" "ALB" "DZA" "AGO" ...## $ year : int 2001 2001 2001 2001 2001 2001 2001 2001 2001 2001 ...## $ type : chr "Armed Assault" "Armed Assault" "Armed Assault" "Armed Assault" ...## $ num_attacks: num 2 0 80 22 0 0 0 0 2 0 ...## $ GDPpc : num NA 2454 3617 2214 7776 ...## $ population : num 20531160 3060173 31590320 15562791 37471535 ...## $ tradeofgdp : num NA 57.4 58.7 150.3 21.9 ...## $ polity2 : int NA 5 -3 -3 8 5 10 10 -7 -8 ...Step 1: Explore the Data
- The variables of interest are
num_attacksandpolity2;
summary(terr_attacks[,c("num_attacks","polity2")])Check how each variable is coded, recode as needed
Address any missingness
There are 320 missing values on the
polity2variable.It is safe to assume that regimes with "unknown" regime types are not democracies.
terr_attacks$dem<-"Autocracy"terr_attacks$dem[terr_attacks$polity2>7]<-"Democracy"*The polity2 variable is obtained from (the Polity V Project)[http://www.systemicpeace.org/inscrdata.html]. Go to its website to check out its codebook.
Step 2: Set Up the Data
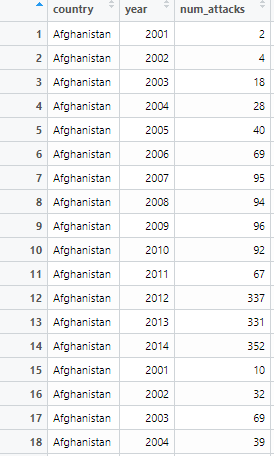
The unit of analysis in the
terr_attacksdata is country-year.Our research question asks for a comparison among country-types (democracies vs non-democracies).
Need to aggregate data by regime type, make regime type the unit of analysis.
Data Management Tool #2: Aggregating


Aggregate by Year


Aggregate by Regime Type


Aggregating using summarise
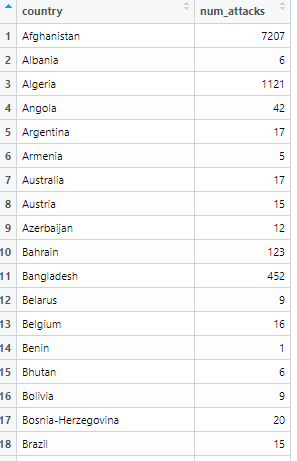
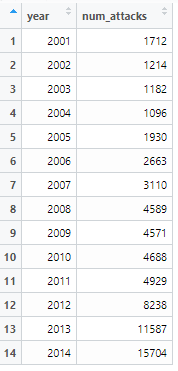
library(tidyverse)library(magrittr)# by countryterr_attacks %>% select(country, year, num_attacks, everything()) %>% group_by(country) %>% summarise(num_attacks=sum(num_attacks), .groups="keep")#by yearterr_attacks %>% select(country, year, num_attacks, everything()) %>% group_by(year) %>% summarise(num_attacks=sum(num_attacks), .groups="keep")library(tidyverse)library(magrittr)#by regimeattks <-terr_attacks %>% group_by(dem) %>% summarise(`num_attacks`=mean(`num_attacks`),.groups="keep")*Note that %>% is called the pipe operator and means "then", i.e. the code above says "group by country, then summarise the number of armed assaults"
num_attacks by Regime Type
library(ggplot2)#Set theme options:theme_set(theme_grey() + theme(panel.background = element_rect(fill = NA, color = 'black'))+ theme(axis.text=element_text(size=10), axis.title=element_text(size=12,face="bold")))ggplot(data=attks, aes(x=dem,y=num_attacks))+geom_bar(stat="identity", fill="gray80", width=.5)+ylab("Average Number of Attacks")+scale_x_discrete("Regime Type")+coord_flip()
Your Turn
- Aggregate the data to show the mean and the median GDP/cap for each country over the entire time-period, i.e. your unit of analysis will be country rather than country-year.
Hint: Use ?summarise to find out how to get the median.
Adding Nuance
Are democracies more vulnerable to certain types of attacks?
- Need to aggregate by regime and attack type
attks1 <-terr_attacks %>% group_by(dem, type) %>% summarise(`num_attacks`=mean(`num_attacks`),.groups="keep")Your Turn
Plot number attacks by regime type. Facet by the type of attack.
Are democracies more vulnerable to certain types of attacks? Which ones? Why do you think that is?
RColorBrewer
Pre-set color schemes:
library(RColorBrewer)display.brewer.all(n=NULL, type="all", select=NULL, exact.n=TRUE, colorblindFriendly=TRUE)
Over Time
attks2 <-terr_attacks %>% group_by(dem, type, year) %>% summarise(`num_attacks`=mean(`num_attacks`),.groups="keep")attks2$type<-recode(attks2$type,"Bombing/Explosion"="Explosion", "Facility/Infrastructure Attack"="Facility Attack", "Hostage Taking (Kidnapping)"="Kidnapping", "Hostage Taking (Barricade Incident)"="Barricade")ggplot(data=attks2, aes(x=year,y=num_attacks, fill=dem))+ geom_bar(stat="identity", position="fill")+ facet_wrap(~type)+ylab("Proportion")+ scale_x_continuous(breaks=seq(from=2001,to=2014,by=6))+scale_fill_brewer(name="Regime type", palette="Dark2")+theme_classic()ggplot(data=attks2, aes(x=year,y=num_attacks, fill=dem))+ geom_bar(stat="identity")+ facet_wrap(~type, scale="free")+ylab("Number of Attacks")+scale_fill_brewer(name="Regime type", palette="Dark2")+ scale_x_continuous(breaks=seq(from=2001,to=2014,by=6))+theme_classic()Line Plots vs Bar Graphs
What can you tell from a line plot that you could not from the corresponding bar graph?
Why overlay a line plot with a scatter plot?
What are the advantages of plotting separate lines vs a single line (proportion)?
Why do we need a horizontal line at y=0.5?
ggplot(data=attks2, aes(x=year,y=num_attacks, color=dem))+ geom_line(size=1)+geom_point(size=1)+ facet_wrap(~type, scale="free")+ylab("Number of Attacks")+scale_colour_brewer(name="Regime type", palette="Dark2")+ scale_x_continuous(breaks=seq(from=2001,to=2014,by=6))+theme_classic()+theme(legend.position="bottom")attks3<-attks2 %>% pivot_wider(names_from=dem,values_from=num_attacks) %>% mutate(prop_dem=Democracy/(Autocracy+Democracy))ggplot(data=attks3, aes(x=year,y=prop_dem))+ geom_line(size=1)+geom_point(size=1)+ facet_wrap(~type)+ geom_hline(aes(yintercept=.5), linetype=2)+ ylab("Proportion of Democracies")+scale_colour_brewer(name="Regime type", palette="Dark2")+ scale_x_continuous(breaks=seq(from=2001,to=2014,by=6))+theme_classic()Utilize Proximity
- If you wanted to know what attack type is equally likely in both an autocracy and a democracy? which plot makes this easier to answer?


Your Turn
Make the two plots from the previous slide.
What We Learned
Dealing with missing data
Aggregating using
summariseBar graphs, line plots
Raw numbers vs. proportions
Utilizing proximity
Fill, system of coordinates