POL 478H1 F
Intro to Graphics
Olga Chyzh [www.olgachyzh.com]
Bad Visualizations
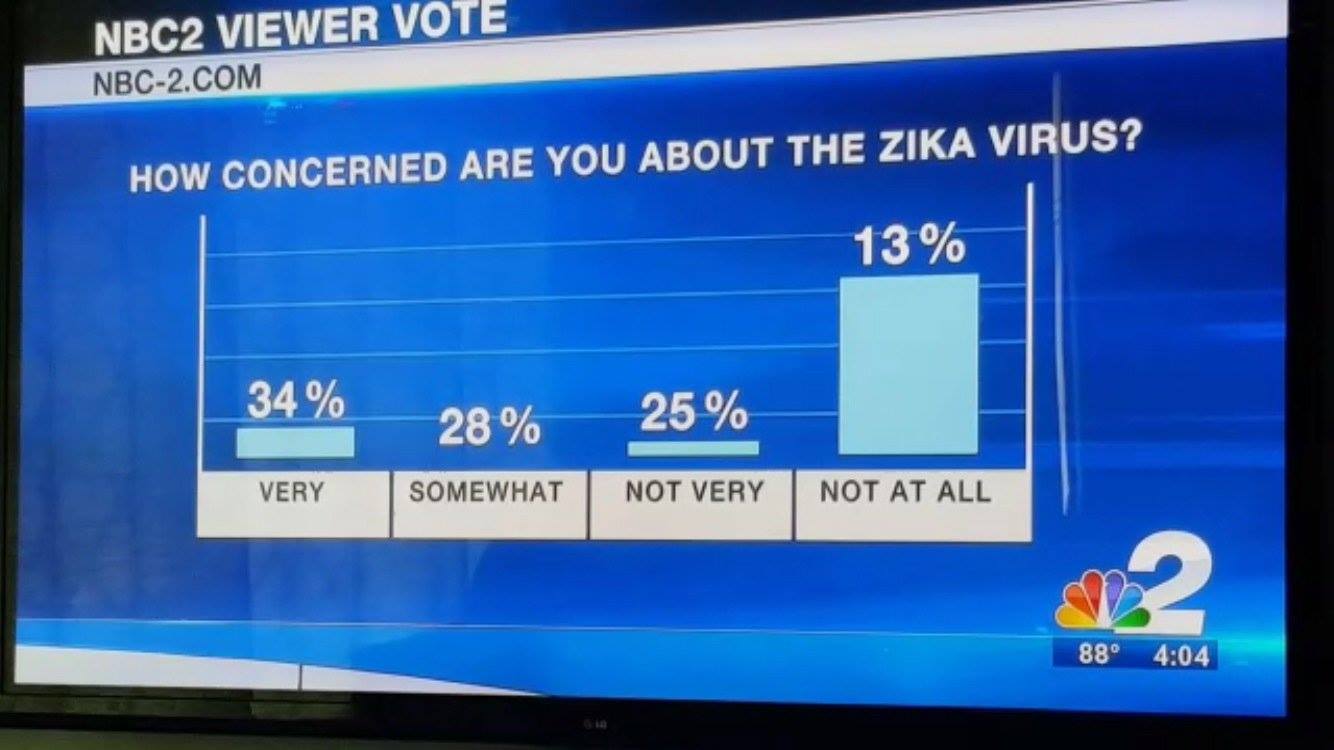
Bad Visualizations
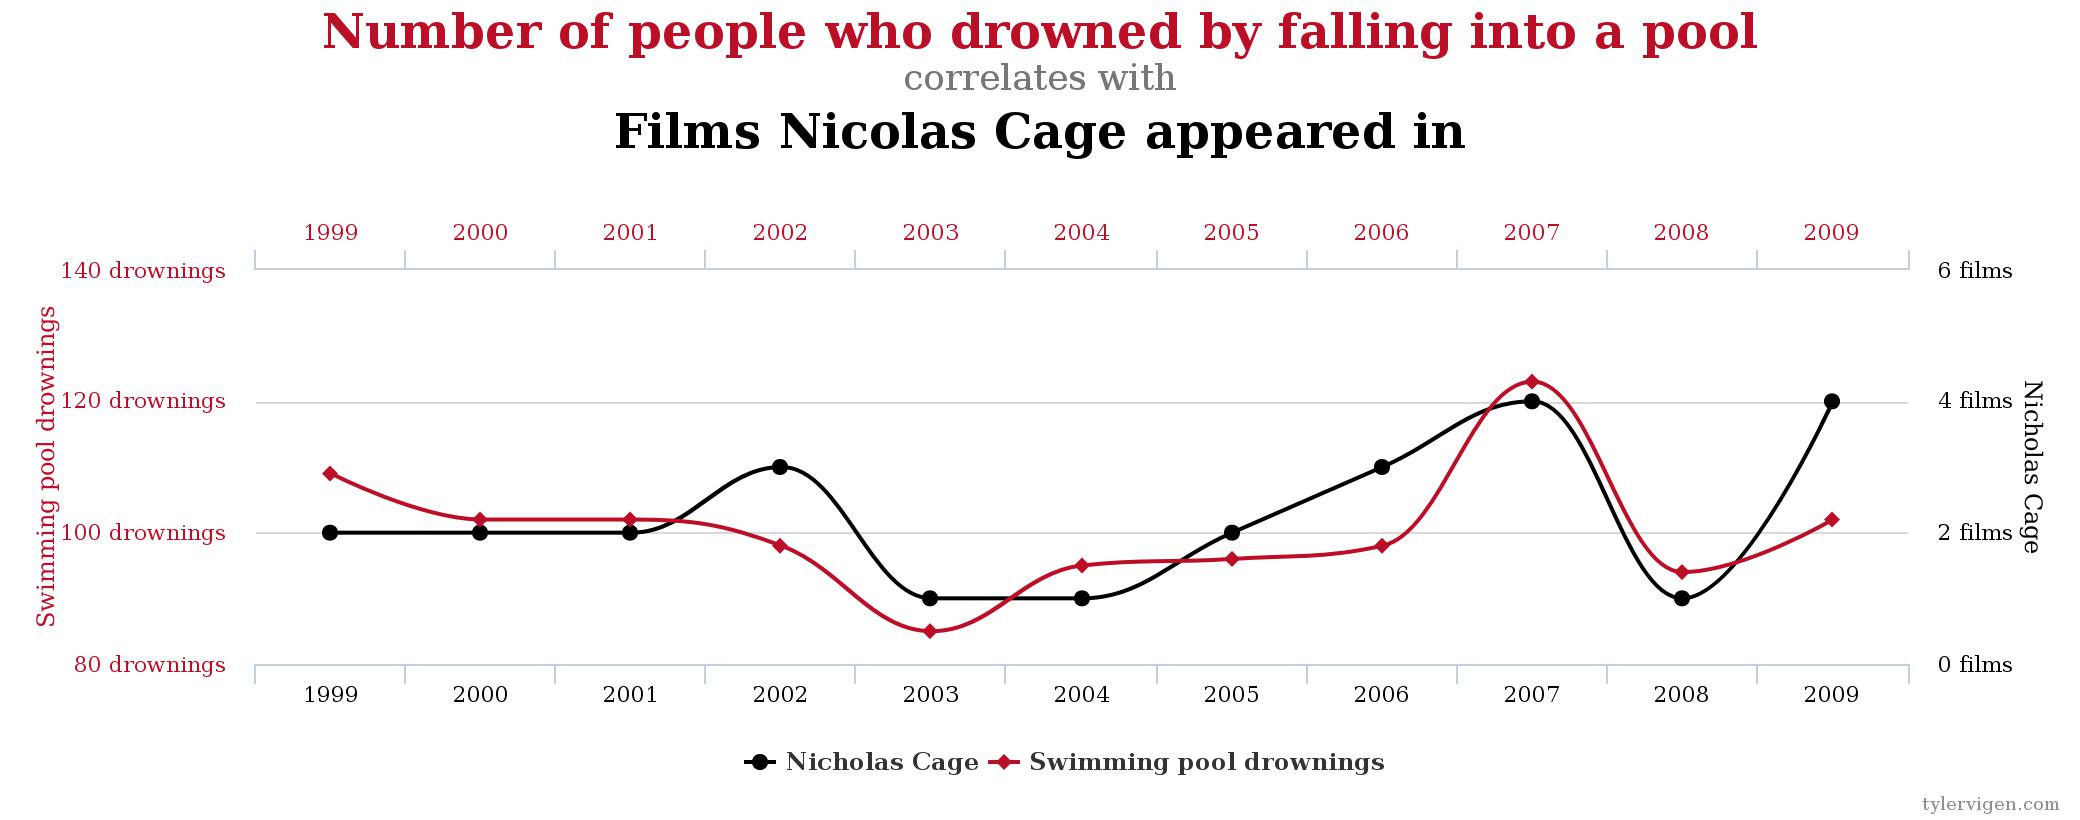
Bad Visualizations
Younger adults are large percentage of coronavirus hospitalizations in United States, according to new CDC data
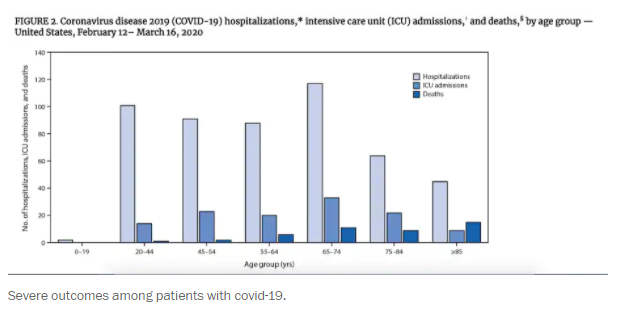
Source: The Washington Post
Bad Visualizations
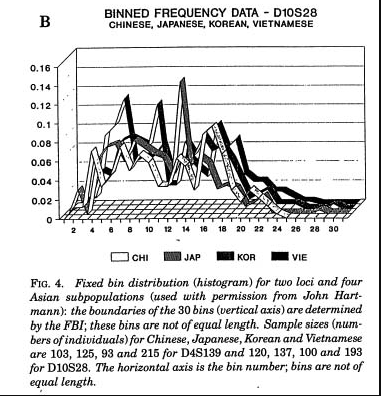
Source: Roeder K (1994) DNA fingerprinting: A review of the controversy (with discussion). Statistical Science 9:222-278, Figure 4
Thoughtful Visualization
Start with a thoughtful question about your data.
Think of several alternative ways to show the same relationship (e.g., vary plot type, color, size, facetting, etc.)
Motivate every option in function
Prioritize reader-friendliness (e.g., are you using color-blind friendly colors?)
Attention to detail (titles, labels, axes, ticks, grids, etc.)
Asking Questions about the Data
Make a list of questions you think you can answer by analyzing the data on terrorist attacks. Write down as many as you can.
Example 1:
What is the relationship between armed assaults and bombings? Are they complements or substitutes?
- two continuous variables--> a scatterplot
ggplot2: Grammar of Graphics
A plot consists of:
mappings
(aes): variables that are mapped to graphical elementslayers: graphical elements (
geomssuch as points, lines, rectangles, text, etc.) and statistical transformations (statssuch as identity, counts, bins, etc.)scales: map values in the data space to values in the aesthetic space (color, size, shape, position)
coordinate system
(coord): Cartesian, but can be othersfacetting: subsetting and arranging data
theme: fine-tuning the result, e.g. font, background, margins
Load the data on global terrorist attacks
library(classdata)data("terr_attacks.wide")str(terr_attacks.wide)## Classes 'tbl_df', 'tbl' and 'data.frame': 2015 obs. of 16 variables:## $ country : chr "Afghanistan" "Albania" "Algeria" "Angola" ...## $ ccode : num 700 339 615 540 160 371 900 305 373 692 ...## $ cabb : chr "AFG" "ALB" "DZA" "AGO" ...## $ year : int 2001 2001 2001 2001 2001 2001 2001 2001 2001 2001 ...## $ GDPpc : num NA 2454 3617 2214 7776 ...## $ population : num 20531160 3060173 31590320 15562791 37471535 ...## $ tradeofgdp : num NA 57.4 58.7 150.3 21.9 ...## $ polity2 : int NA 5 -3 -3 8 5 10 10 -7 -8 ...## $ Armed Assault : num 2 0 80 22 0 0 0 0 2 0 ...## $ Bombing/Explosion : num 10 1 17 5 2 0 0 0 1 0 ...## $ Facility/Infrastructure Attack : num 2 0 2 5 0 0 1 0 1 0 ...## $ Assassination : num 0 0 4 0 0 2 0 0 0 0 ...## $ Hostage Taking (Kidnapping) : num 0 0 3 3 0 0 0 0 0 0 ...## $ Unarmed Assault : num 0 0 0 0 0 0 1 0 0 0 ...## $ Hijacking : num 0 0 0 0 0 0 0 0 0 0 ...## $ Hostage Taking (Barricade Incident): num 0 0 0 0 0 0 0 0 0 0 ...library(ggplot2)ggplot(data=terr_attacks.wide, aes(x=`Armed Assault`, y=`Bombing/Explosion`))+geom_point()ggplot(data=terr_attacks.wide, aes(x=log(`Armed Assault`+1), y=log(`Bombing/Explosion`+1)))+geom_point()ggplot(data=terr_attacks.wide, aes(x=`Armed Assault`+1, y=`Bombing/Explosion`+1))+geom_point()+scale_y_log10("Bombing/Explosion", breaks=c(1,11,101,1001,10001),labels=c("0","10","100","1000","10000"))+scale_x_log10("Armed Assault", breaks=c(1,11,101,1001,10001),labels=c("0","10","100","1000","10000"))Interpreting Scatterplots
General patterns
- Form and direction
- Strength
Localized patterns
Deviations from the pattern
- Outliers
Interpreting Scatterplots: Example
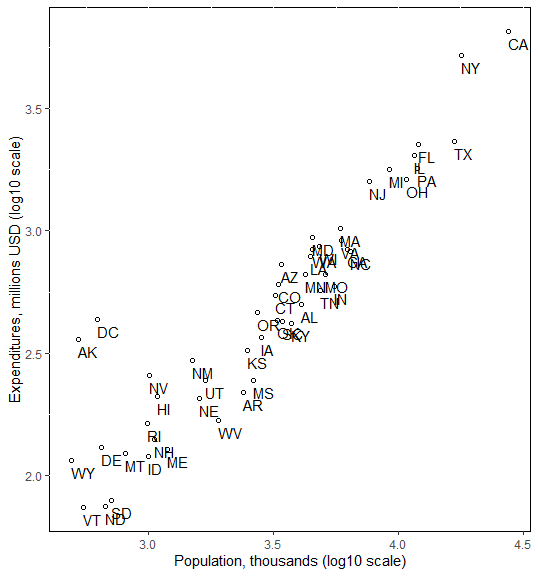
- Form: Roughly linear, several distinct groups
- Strength: pretty strong. Data points form a line.
- Direction: Positively Associated.
- Outliers: AK, DC, NY, CA.
Looking at Conditional Relationships
Can use color, size, shape, etc. to show additional information
E.g., can color observations based on regime type. (Why?)
- Data Management Tool #1: Recoding
terr_attacks.wide$dem<-"Autocracy"terr_attacks.wide$dem[terr_attacks.wide$polity2>7]<-"Democracy"Color by Regime Type
library(ggplot2)terr_attacks.wide$dem<-"Autocracy"terr_attacks.wide$dem[terr_attacks.wide$polity2>7]<-"Democracy"ggplot(data=terr_attacks.wide, aes(x=`Armed Assault`+1, y=`Bombing/Explosion`+1, colour=dem))+geom_point()+scale_y_log10("Bombing/Explosion", breaks=c(1,11,101,1001,10001),labels=c("0","10","100","1000","10000"))+scale_x_log10("Armed Assault", breaks=c(1,11,101,1001,10001),labels=c("0","10","100","1000","10000"))+ scale_colour_discrete(name = "Regime Type")
Printer-Friendly Plot
If intended for print, consider using a gray scale.
ggplot(data=terr_attacks.wide, aes(x=`Armed Assault`+1, y=`Bombing/Explosion`+1, colour=dem))+geom_point()+scale_y_log10("Bombing/Explosion", breaks=c(1,11,101,1001,10001),labels=c("0","10","100","1000","10000"))+scale_x_log10("Armed Assault", breaks=c(1,11,101,1001,10001),labels=c("0","10","100","1000","10000"))+ scale_colour_grey(name = "Regime Type")
Or change marker type rather than colors
ggplot(data=terr_attacks.wide, aes(x=`Armed Assault`+1, y=`Bombing/Explosion`+1, shape=dem,))+geom_point()+scale_y_log10("Bombing/Explosion", breaks=c(1,11,101,1001,10001),labels=c("0","10","100","1000","10000"))+scale_x_log10("Armed Assault", breaks=c(1,11,101,1001,10001),labels=c("0","10","100","1000","10000"))+scale_shape_manual(name = "Regime Type",values=c(1,3))
Colorblind-Friendly Colors
cbPalette <- c("#999999", "#E69F00", "#56B4E9", "#009E73", "#F0E442", "#0072B2", "#D55E00", "#CC79A7")cbbPalette <- c("#000000", "#E69F00", "#56B4E9", "#009E73", "#F0E442", "#0072B2", "#D55E00", "#CC79A7")ggplot(data=terr_attacks.wide, aes(x=`Armed Assault`+1, y=`Bombing/Explosion`+1, colour=dem))+geom_point()+scale_y_log10("Bombing/Explosion", breaks=c(1,11,101,1001,10001),labels=c("0","10","100","1000","10000"))+scale_x_log10("Armed Assault", breaks=c(1,11,101,1001,10001),labels=c("0","10","100","1000","10000"))+ scale_colour_manual(name = "Regime Type", values=cbPalette)
Set Theme Options
- Control the overall looks of your plot
?theme
#Set theme options:theme_set(theme_grey() + #set the theme to the canned theme named "theme_bw" theme(panel.background = element_rect(fill = NA, color = 'black'))+ #remove the background color (fill), make the axes black theme(axis.text=element_text(size=10), axis.title=element_text(size=12,face="bold")))Scale by GDP/cap
ggplot(data=terr_attacks.wide, aes(x=`Armed Assault`+1, y=`Bombing/Explosion`+1, colour=dem,size=GDPpc))+geom_point()+scale_y_log10("Bombing/Explosion", breaks=c(1,11,101,1001,10001),labels=c("0","10","100","1000","10000"))+scale_x_log10("Armed Assault", breaks=c(1,11,101,1001,10001),labels=c("0","10","100","1000","10000"))
Facetting
Can facet to display plots of subsets of data: facet_wrap, facet_grid
E.g., can facet by region, year, etc.
facet_wrapoptimizes the number of rows and columnsfacet_gridallows you to decide to facet by column, row, or both (if conditioning on two variables). Works best if the conditioning variables have 2-4 categories.
More Recoding
- Code the
regionvariable fromccode.
terr_attacks.wide$region<-NAterr_attacks.wide$region[terr_attacks.wide$ccode<200]<- "The Americas"terr_attacks.wide$region[terr_attacks.wide$ccode>=200 & terr_attacks.wide$ccode<401]<- "Europe"Your Turn
Code the rest of the values of region using the following coding scheme:
| ccode | region |
|---|---|
| 401--599 | Africa |
| 600--699 | Middle East |
| 700--899 | Asia |
| ≥ 900 | Australia and Oceania |
Facet by Region
ggplot(data=terr_attacks.wide, aes(x=`Armed Assault`+1,y=`Bombing/Explosion`+1,colour=dem,size=GDPpc))+facet_wrap(~region)+geom_point()+scale_y_log10("Bombing/Explosion", breaks=c(1,11,101,1001,10001),labels=c("0","10","100","1000","10000"))+scale_x_log10("Armed Assault", breaks=c(1,11,101,1001,10001),labels=c("0","10","100","1000","10000"))
ggplot(data=terr_attacks.wide, aes(x=`Armed Assault`+1,y=`Bombing/Explosion`+1,size=GDPpc))+facet_grid(region~dem)+ geom_point()+ scale_y_log10("Bombing/Explosion",breaks=c(1,11,101,1001,10001),labels=c("0","10","100","1000","10000"))+ scale_x_log10("Armed Assault",breaks=c(1,11,101,1001,10001),labels=c("0","10","100","1000","10000"))
What We Learned
Intro to thoughtful graphics
Scatterplots using
ggplot2- Color, size, facetting
Using logged scales
Titles, breaks, and labels
Recoding variables